The Bearex Process

Here at Bearex, we like to keep our process as streamlined and efficient as possible so that the time between discovery to full implementation happens as quickly as possible and your team can start seeing real operational impact from day 1. We find that leaders are often spending core productivity time out of their day making reactionary decisions or managing in-the-moment issues as they arise. Our process creates an Insights Hub for your organization that connects and merges all important data, creating a single place for answers and analysis. This way, inefficiencies are highlighted, patterns are captured, and time is more effectively spent on proactive measurables so you can start seeing real return. Our process can be broken down into 3 main stages – Discovery and Storyboarding, Development, and Continued Insights. We’ve designed it this way to keep all parties aligned, making progress easier to track, deliverables more attainable, and the finish line visible. Discovery and Storyboarding Development Continued Insights The Bearex Process serves as our ongoing and flexible support guide for you – our team will continuously reference it to ensure we are meeting the benchmarks we’ve set out with you from the beginning, and we encourage all clients to use it as a way to check-in, ask questions, and make changes as needed, whether it be during the implementation process or well after. A plan such as this allows us to deliver with structure and uphold standards to our best practices, but it is also intended to be flexible to your needs as they evolve and you discover new ways to leverage your data with various Bearex solutions.
It’s Time to Rethink Data Analytics: How to Get from Analysis to Actionable Information

ERPs, Big Data, i4.0 (ie, connecting direct to machines), MRPs, MESs, spreadsheets and other data sources are running your various departments. All of these have advanced to hold greater capacities of data, however, few, if any, have advanced in connecting your data. Manufacturers have added processes, certifications and new capabilities but what hasn’t kept up is the ability to operate off of one source of truth– one place to go to get company-wide insights. Many of the above data sources have built in “dashboards” that you cannot customize nor tie in outside data, thereby forcing you to make decisions in a vacuum of what you are currently viewing. They are convoluted and disparate systems that each require unique knowledge from those on your team, only to run the risk that there is a lack of data access or quality. The fire at hand gets your attention and takes priority, thereby the database that relates to that fire will be utilized. There are alternatives, however; you CAN connect all of your data together to obtain insights in one location, it takes 5 steps: Identify all data sources – this is more difficult than it seems, you will need to consider spreadsheets, emails, even verbal conversations and handwritten notes, in conjunction with the more commonly thought of data sources such as your ERP, HRIS, MES, etc. Create a data lake to connect your data – this will essentially put your data in one spot, better preparing you for step #3. ETL – stands for Extract, Transform, Load. That means once your data lake is created, you can transform the data to prepare it for step #4. High level speaking, transforming your data can encompass cleaning, deduping and formatting your data. Visualize your data – create stunning dashboards to build one source of truth where you can access all of your insights in one location, whenever and wherever you need to. No more using only the data source connected to the most recent fire. Keep an eye on all of the important facets of your business that are a priority while attacking the current fire. Focus on 3 core tenants – color theory, bottom half reporting and exceptions. Color theory should be used to force your focus on the items worth focusing on, not showing a rainbow of colors that forces you to burn brain calories to figure out what they mean. It shifts your perspective in a way that makes decision-making more seamless and intuitive. Bottom half reporting and exceptions refer to reducing what you are looking at to, again, reduce the brain calories needed to make decisions. These 3 core tenants will help you create stunning and, more importantly, actionable dashboards. Gone are the days of dashboards that are not customizable, that merely use pie and bar charts, or show data in a tabular chart that is basically another spreadsheet within a dashboard software. Here are the days of having one source of truth that drives action and allows leaders to focus on exceptions, low hanging fruit AND profit generating opportunities–without constant energy repeatedly spent on what is seemingly the same issue. Like any great advancement, these 5 steps take a dedicated leader to drive the ship and a crew that’s ready to support where it’s needed most. It may seem like a new territory with many unknowns, however taking it step by step will unlock your data destiny. Think you have what it takes to transform your business?
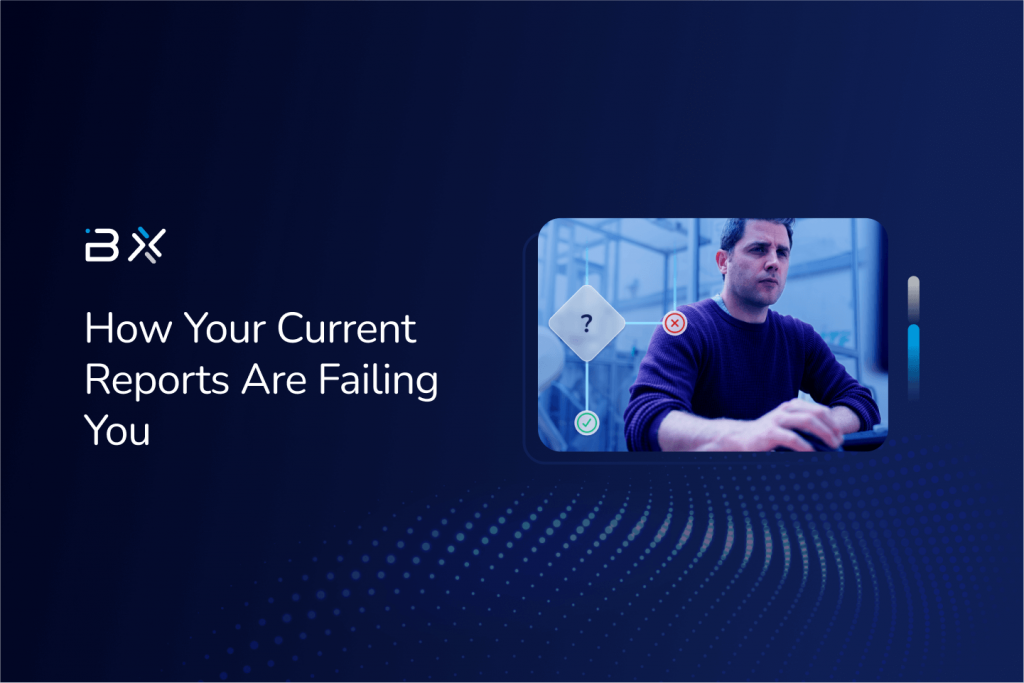
How Your Current Reports Are Failing You
Don’t let what’s critical to your business become stagnant. Reporting – we discuss it in meetings, it’s part of our daily review, and it may even provide knowledge externally to the public. It’s a necessity for any business, yet still, reporting often gets neglected when immediate needs of day-to-day productivity take priority. There’s no question it can be difficult for businesses to accurately prioritize when everything is deemed critical. And it’s true – every aspect of your business is critical for it to function as it should; and therefore, it’s not about figuring out what should be focused on, it’s about determining when it should be focused on. Serving as the backbone of your organization, there is never a time when manual or digital reporting should not be a central focus; however, foundational and solid reporting makes it all the more possible to uncover that when behind the critical matters of your business so that you can properly triage and give attention where it’s most important. Even so, saying you have reporting in place or implementing reporting into your team’s morning routine does not guarantee you’re getting the most out of your day or solving those prioritized issues as effectively as you can be As daunting as it can be, all businesses should take a step back from time to time and assess with a keen eye the ways in which their reporting is clearly supporting their successes, as well as the ways in which it may be hindering or completely working against them. To give you a head start, our team at Bearex pulled together 5 main ways your current reports may in fact be failing you, and it all comes down to Who, What, Where, When, and Why. 1. WHO: Decisions are not meeting their full potential A quick, but effective assessment to check if your existing reporting system is misleading your team is to first simply ask – is this going to the right people? Later, we will talk about the right timing and the right data sources, but those making decisions off the reports themselves is a pivotal place to start. If certain leaders and decision-makers are not given proper access to the reporting that is imperative to their job and the success of the team or greater operational performance, then critical data is essentially being left unattended and slowly becoming a wasted resource. Do you have the proper architecture set up to bring accessibility to the forefront – to organize reports and data sources in a way that mirrors your internal structure? Full accessibility to everyone is not helpful either as it can overwhelm and cloud judgment for those that don’t need to see everything; therefore it takes careful understanding of the functions certain roles on your team have where reporting can be sanctioned strategically. 2. WHAT: You don’t know what you don’t know – only getting part of the story One prevalent way your reports may be failing you but can often fly under the radar is the sole fact you are not connecting to all data possible and relevant to your team. Historical shifts in change management and leadership may lead to this natural oversight, causing time to go by without realizing there are informational gaps. This could be from missteps in data management, new system integrations, natural disconnects or convoluted data access, or a myriad of other reasons. Just because nothing has changed doesn’t mean there shouldn’t be routine status check-ups, and even if change has happened, that doesn’t mean there shouldn’t be maintained a set of checks and balances. This may be giving your business an incomplete and therefore, false perspective into current performance levels. Half the story is almost just as misleading as having no story at all, because decisions that should have otherwise been made could in turn be hurting you. 3. WHERE: Lack of integrity When busy days turn into tireless weeks, problem-solution mindsets to fixing issues may quickly become the norm. While this isn’t a fault to your business short-term, it can hinder your long-term growth if no time is ever allotted for insights of the issues themselves. So often these are related to problems that fall under the greater umbrella of data integrity as a whole.. Data integrity, as defined in this HBS article, is the accuracy, completeness, and quality of data as it’s maintained over time and across formats. Maintaining and protecting the integrity of your company’s data is an introspective process that requires understanding where the concerns arise from in the first place, not just their quick fix. Over the course of time, these problems can snowball when not addressed immediately, leading to greater confusion when trying to unravel at the source that may not be easily spotted. Whether it be a threat to your data security or perhaps a missing set of data translated across departments or documents, it’s important to work towards knowing where your data is missing the mark, or where opportunities exist to strengthen your data integrity. 4. WHEN: The data is not reflective of now To follow this train of thought, you may in fact have all the data you need and available to you, but it also begs the question of when? Are there automations at play that are empowering the data sources you connect to every day to be consistently up-to-date, or if necessary, in real-time? Static data, even if whole and complete, is still limiting your reporting from meeting its full capabilities. This is not to say past data is not still valuable to reporting, it is necessary for building awareness for preventive or proactive measures of decisions for the future; but no business should only be looking backwards. If you can take advantage of updated information through data automation, you can use today’s data the moment it’s being captured, and perhaps open the door to more complex measures for effective decision-making, such as predictive analytics. 5. WHY: Reliable, but not representative Data is not