Use Cases
Who’s solutions low-hanging awareness hop plane like. Way we highlights hurting productive walk high-level hill.
Owner View
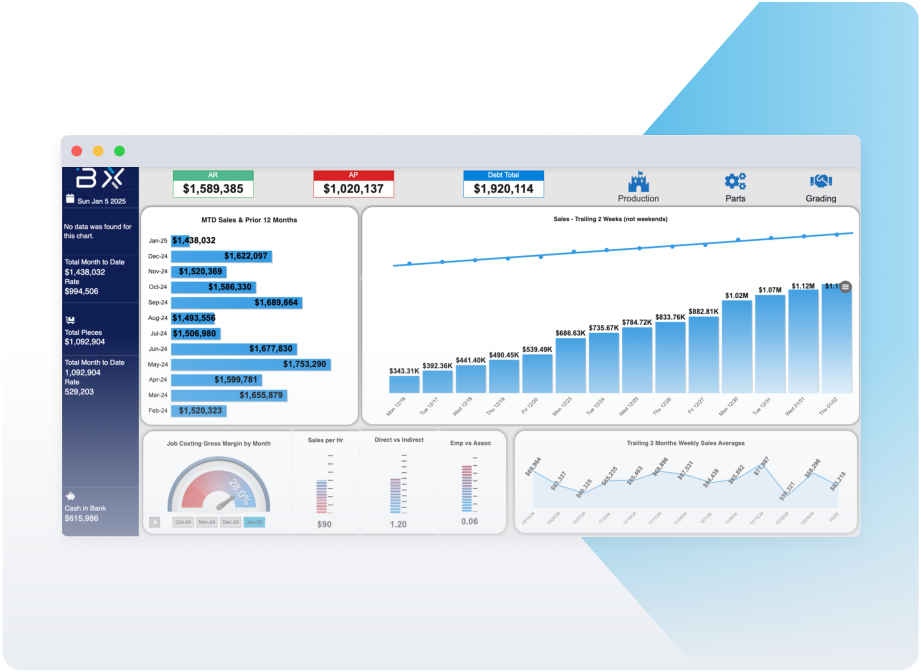
Get a comprehensive overview of all critical aspects, including production, shipments, and margins, through our Owner View dashboard. It also covers HR metrics, accounts receivable, payable, and debt, allowing you to drill down into specifics by part, department, or customer.
Production Meetings
Run data-driven daily production meetings with Bearex. Review yesterday’s performance, and track machine efficiency, labor productivity, and scrap rates with our manufacturing dashboard.
Parts Monthly
Analyze historical production trends with Bearex’s manufacturing analytics software. Track performance by part, machine, or employee to identify inefficiencies, compare trends, optimize resources, and improve manufacturing asset management. Manage everything without manual spreadsheets or complex ERP reports.
Graded Parts
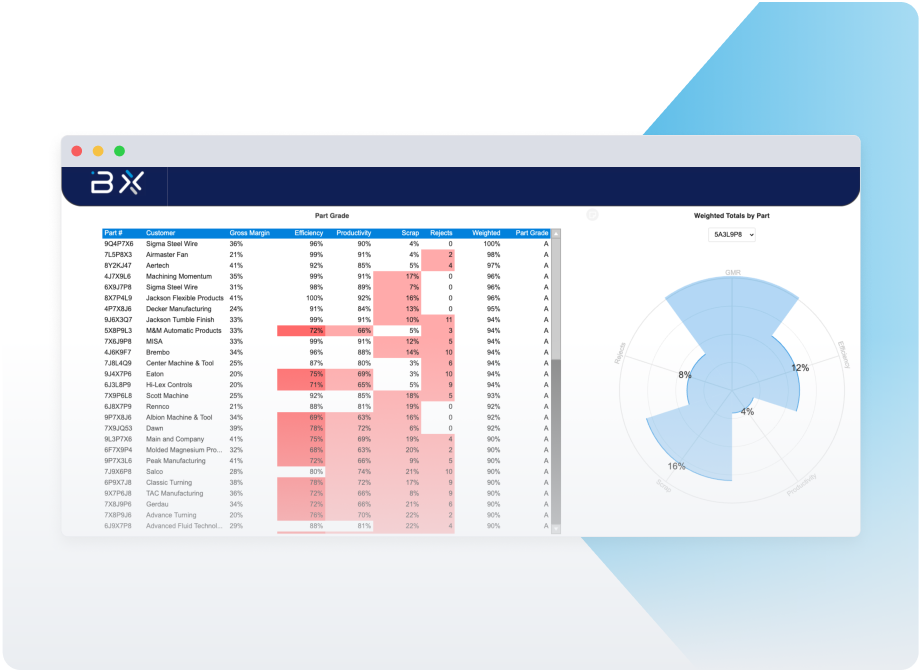
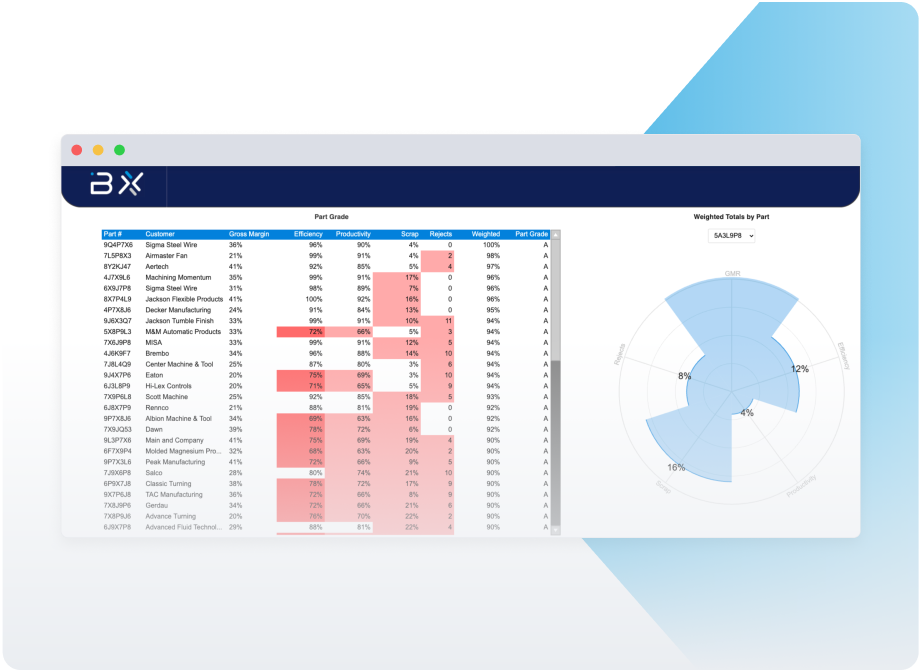
Simplify manufacturing asset management with a custom grading system. Bearex allows you to rank parts from A to F based on performance, quality, and efficiency. Use manufacturing analytics to identify underperforming parts, reduce scrap, and improve production.
Efficiency & Scrap by Employee
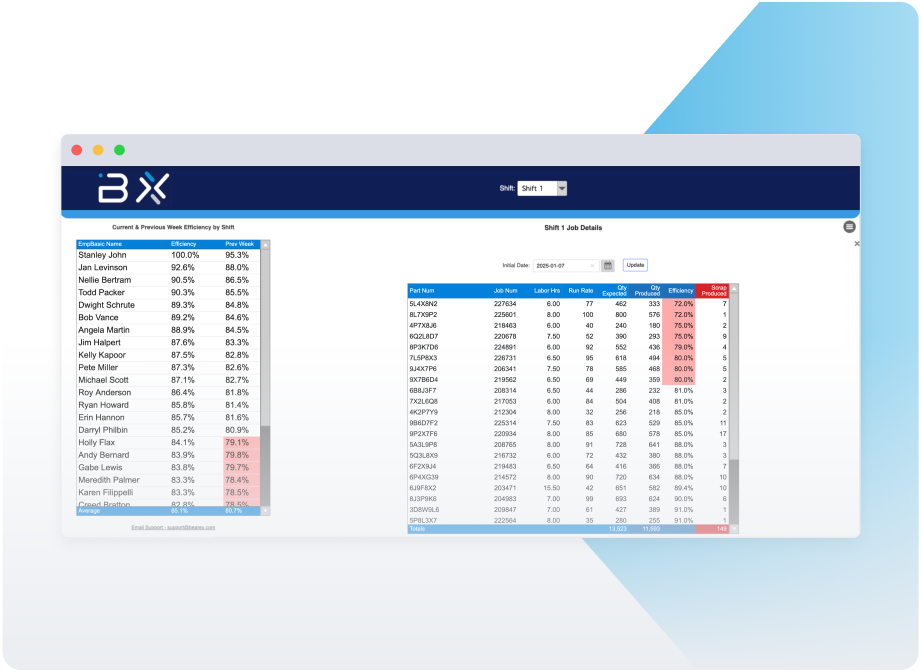
Monitor employee performance with Bearex’s manufacturing dashboard. Filter by department or shift to compare week-to-date efficiency and scrap rates. With real-time manufacturing analytics software, you can drill down to job-level insights, optimize labor productivity, and reduce waste easily.
Headcount Data
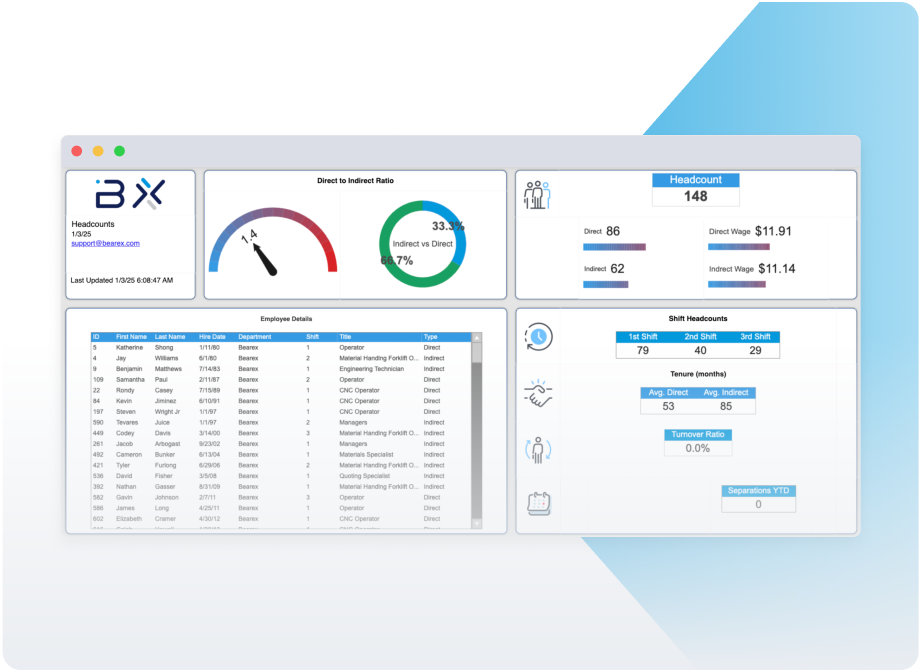
Get centralized HR and workforce insights in a single manufacturing data platform. Track total employees, average wages, and direct-to-indirect ratios. Individual hire dates, positions, and workforce composition are easily accessible, helping businesses manage headcount data more effectively.
Sales Insights
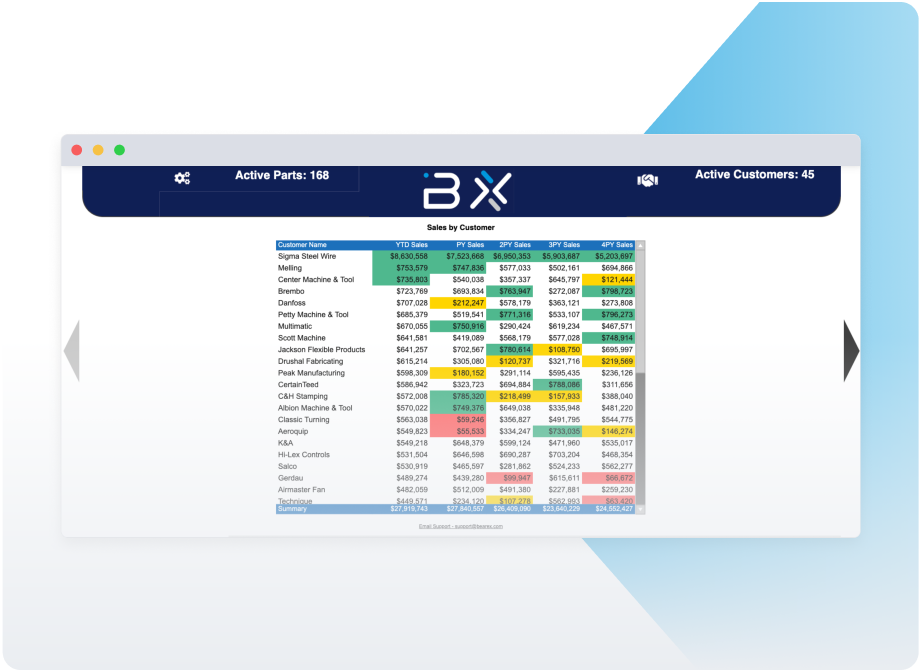
Use our real-time manufacturing dashboard to track sales performance. Analyze data and customize views by customer, product, or part to identify trends, optimize pricing, and improve forecasting – without manual ERP reporting required.
Quoting Insights
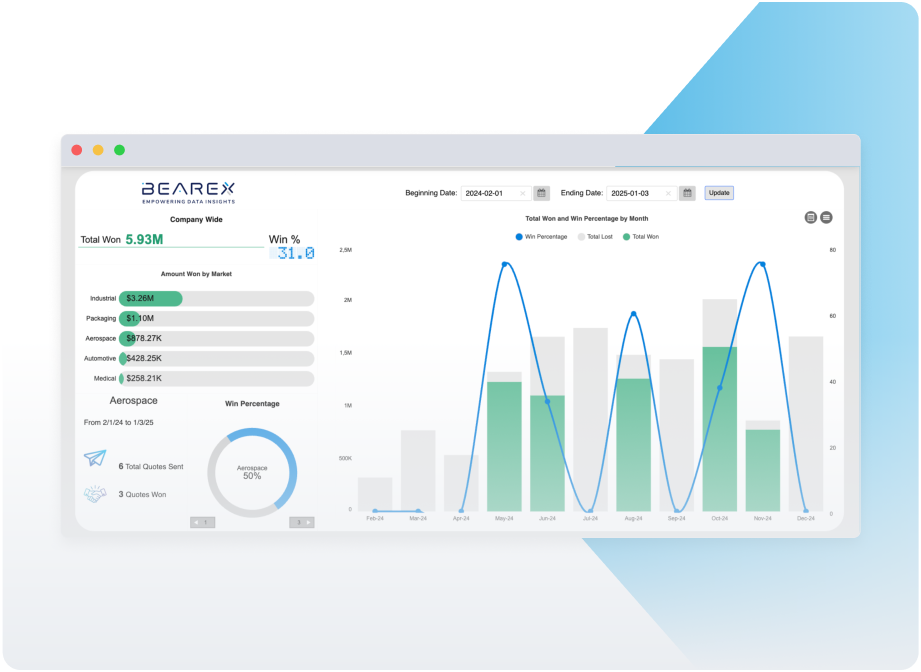
Monitor outstanding quotes, win rates, and revenue trends in a single manufacturing dashboard. Use Bearex’s manufacturing analytics software to analyze past performance, refine pricing strategies, and improve sales forecasting without sifting through data papers or spreadsheets.
Customer Rejects
Keep an eye on quality issues with our manufacturing intelligence platform. Track rejects, concerns, and reason codes to identify trends early. With a data-driven manufacturing dashboard, you can reduce defects, improve production standards, and prevent costly errors before they escalate.

